Move from data to action with
Homeroom Dashboards,
now with built-in AI
GET STARTED Empower insight-
driven decisions
Move beyond static charts to get the
evidence-based clarity needed to drive
student outcomes.

Explore the benefits
Dashboards flex with the user and time of year, so you automatically
surface the critical data educators need for right-now relevance.
-
Track student
growth
Clear visualizations show
group performance at a
glance, with the option
to dive deeper into any
individual record.
-
All in
one place
Channel all the data from
your SIS, state assessments,
student plans, and more into
one easy-to-use interface.
-
Everything is
customizable
Users can view their own
role-based, customizable
dashboard, or spotlight
data focused on a particular
school or group.
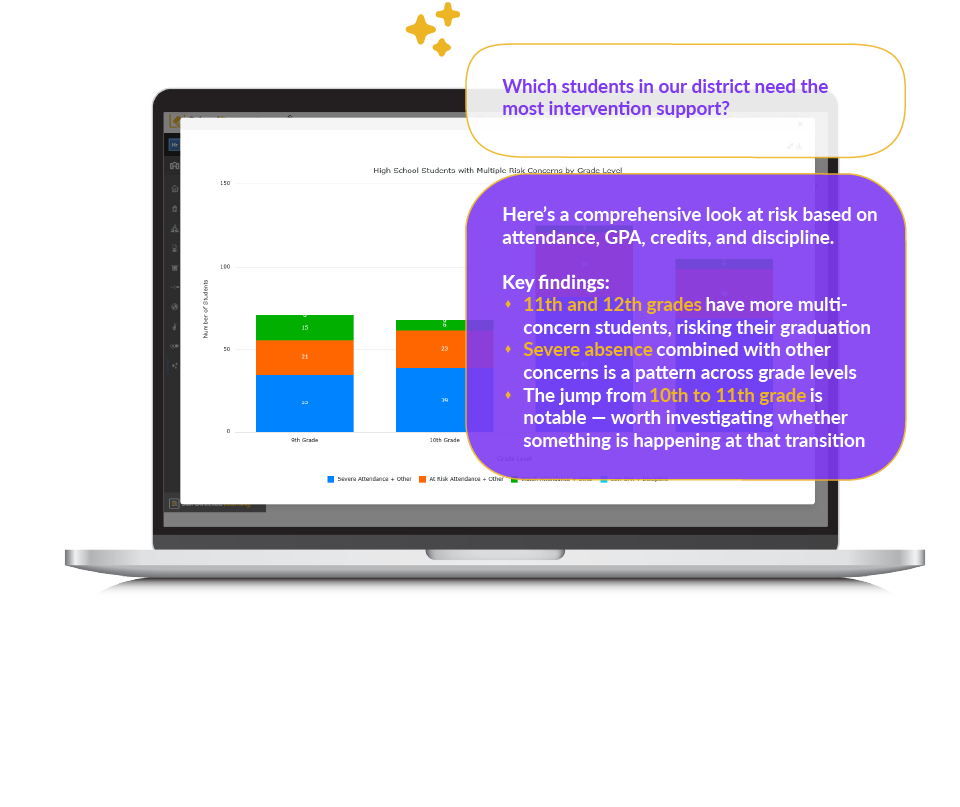
Driven by the data that serves students
Your students can’t wait for next quarter’s report. Connect AI adds an intelligent layer to your Homeroom Dashboards, turning complex attendance, behavior, and academic records into an instant student story. Ask a question in plain English, get clear insights with context, and return your focus to the student in front of you.
What we get out of Homeroom that we can’t get out of our primary SIS is being able to bring together program data with assessment data and have it very, very easily accessible.
Charlotte Davis
Data Specialist, Bellingham Public School District
How it works
Unify and organize all your student information in one powerful and easy-to-use platform.
Homeroom comes with base AI tools that surface the context behind your data — no training, no filters, no fear.
-
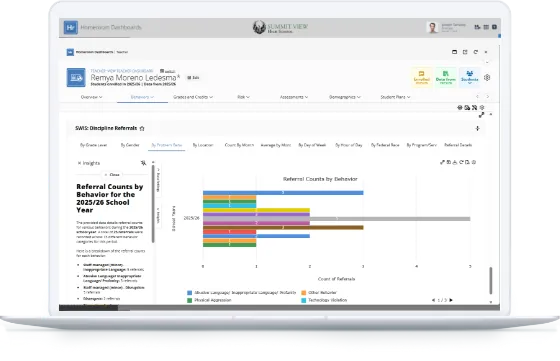
Simplify analysis with an AI-driven narrative
that provides deeper context to inform next steps. -
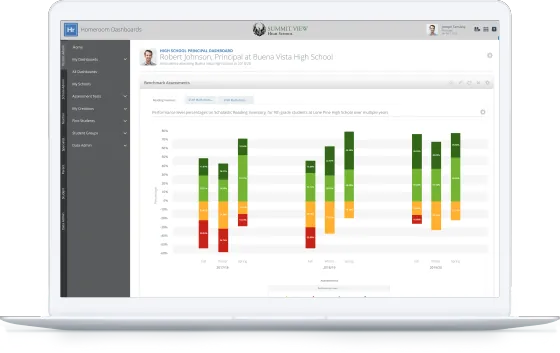
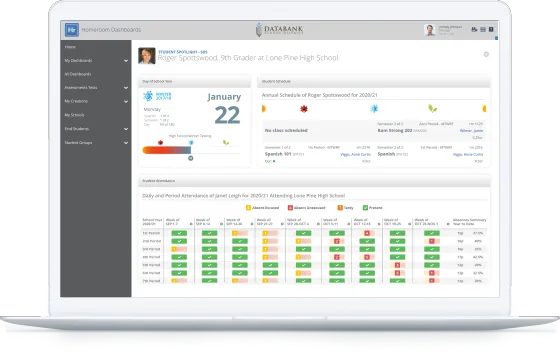
See student scores on assessments as soon as
they’re complete and compare results. -
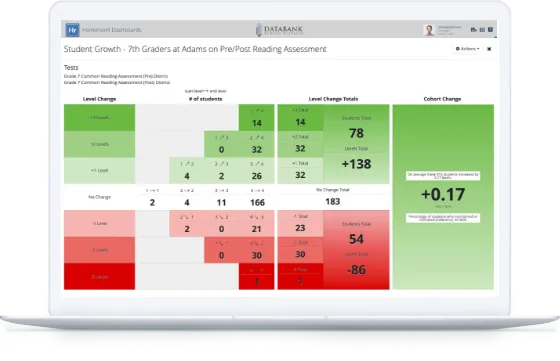
Visualize student growth over time, with automated
progress monitoring and performance tracking. -
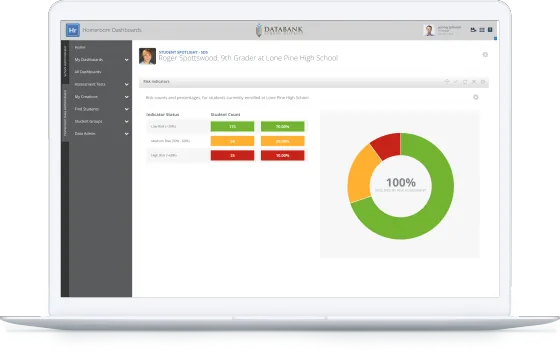
Use aggregated risk indicators, customizable to
your district, to target students for intervention. -
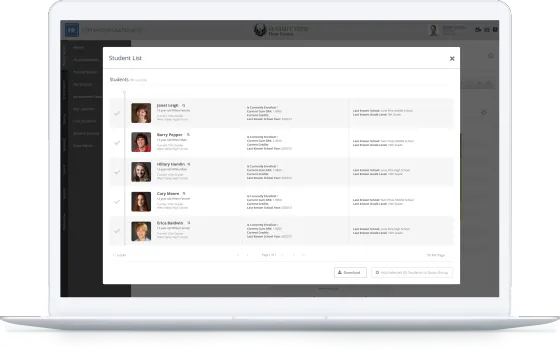
Develop watch lists for Student Groups, filtered to
any criteria — like a demographic trait, club or
activity participation, or GPA range. -
Personalize dashboards to user roles,
seasonal events, and district KPIs.

Data has the power to
drown you — or drive you.
No more sorting through volumes of data
to unearth the information that makes an
impact. With the right data delivered to
educators at the right time, you can move
mountains for your students.